Image Pooling with pooling_image
This section introduces the pooling_image function, which is designed to reduce the size of images while retaining important visual features. Pooling is achieved by dividing the image into non-overlapping windows and applying a specified pooling function, such as mean, max, or min, to each window.
We will demonstrate how to use the pooling_image function with both grayscale and RGB images, showcasing various pooling methods and window sizes to meet your image processing needs. Let’s dive in!
Importing Necessary Libraries
First, we will need to import the necessary libraries and load a grayscale and color (RGB) image to manipulate. We will use matplotlib to display images and numpy for array manipulations.
import numpy as np
import matplotlib.pyplot as plt
from skimage import data
from sharpedge import pooling_image
Preparing Your Image
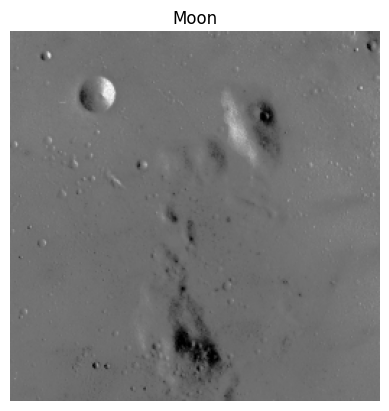
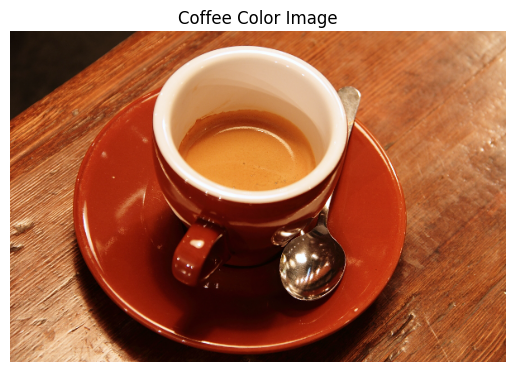
We’ll define the sample images from skimage library. The grayscale image used is the moon image,and the RGB image used is the coffee image
Example 1: Grayscale Image
grayscale_img = data.moon()

# Display the image
plt.imshow(grayscale_img, cmap="gray")
plt.title("Moon")
plt.axis("off")
plt.show()
# Display shape and exact numpy array
print(f'Moon gray image in 2D: {np.shape(grayscale_img)}')
print(grayscale_img)
Moon gray image in 2D: (512, 512)
[[116 116 122 ...  93  96  96]
 [116 116 122 ...  93  96  96]
 [116 116 122 ...  93  96  96]
 ...
 [109 109 112 ... 117 116 116]
 [114 114 113 ... 118 118 118]
 [114 114 113 ... 118 118 118]]
Example 2: RGB Image
# Load the coffee color image from scikit-image
rgb_img = data.coffee()

# Display the image
plt.imshow(rgb_img)
plt.title("Coffee Color Image")
plt.axis('off')
plt.show()
# Display shape and exact numpy array
print(f'Coffee color image in 3D: {np.shape(rgb_img)}')
print(f"First 3 rows and 3 columns (RGB values) of the coffee color image:\n{rgb_img[:3, :3]}")
Coffee color image in 3D: (400, 600, 3)
First 3 rows and 3 columns (RGB values) of the coffee color image:
[[[21 13  8]
  [21 13  9]
  [20 11  8]]

 [[21 13  7]
  [21 13  9]
  [20 14  7]]

 [[21 14  7]
  [23 13 10]
  [20 14  9]]]
Applying the pooling_image Function
We can now apply the pooling_image function to perform pooling on grayscale and RGB images. You can customize the window size and pooling method.
Apply Mean Pooling to the Grayscale Image
Let’s apply pooling to the grayscale image using a 8×8 window and the mean pooling method for this example.
# Apply pooling to the grayscale image
pooled_grayscale_img = pooling_image(grayscale_img, window_size=8, pooling_method=np.mean)

plt.imshow(pooled_grayscale_img, cmap='gray')
plt.title('Pooled Grayscale Image (Mean Pooling)')
plt.axis('off')
plt.show()

print(f'The original shape of the image was:{np.shape(grayscale_img)}')
print(f'The new shape of the image is: {np.shape(pooled_grayscale_img)}')
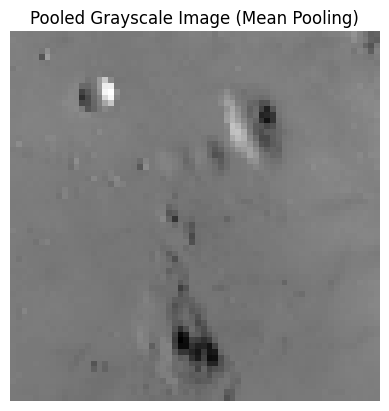
The original shape of the image was:(512, 512)
The new shape of the image is: (64, 64)
Apply Median Pooling to the RGB Image
Next, let’s apply the median pooling method to the RGB image, which will reduce its size. We’ll use a window size of 10x10 for this example.
# Apply pooling to the RGB image
pooled_rgb_img = pooling_image(rgb_img, window_size=10, pooling_method=np.median)

plt.imshow(pooled_rgb_img)
plt.title('Pooled RGB Image (Median Pooling)')
plt.axis('off')
plt.show()

print(f'The original shape of the image was:{np.shape(rgb_img)}')
print(f'The new shape of the image is: {np.shape(pooled_rgb_img)}')

The original shape of the image was:(400, 600, 3)
The new shape of the image is: (40, 60, 3)
Apply Min Pooling to the Grayscale Image
Next, let’s apply the min pooling method to the grayscale image, which will reduce its size. We’ll use a window size of 16x16 for this example.
pooled_grayscale_img2 = pooling_image(grayscale_img, window_size=16, pooling_method=np.min)

plt.imshow(pooled_grayscale_img2, cmap='gray')
plt.title('Pooled Grayscale Image (Min Pooling)')
plt.axis('off')
plt.show()

print(f'The original shape of the image was:{np.shape(grayscale_img)}')
print(f'The new shape of the image is: {np.shape(pooled_grayscale_img2)}')
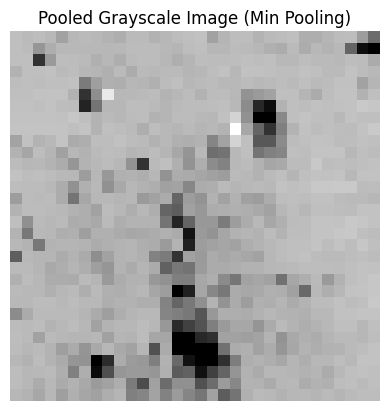
The original shape of the image was:(512, 512)
The new shape of the image is: (32, 32)
Apply Max Pooling to the RGB Image
Finally, let’s apply the max pooling method to the RGB image, which will reduce its size. We’ll use a window size of 25x25 for this example.
# Apply pooling to the RGB image
pooled_rgb_img2 = pooling_image(rgb_img, window_size=25, pooling_method=np.max)

plt.imshow(pooled_rgb_img2)
plt.title('Pooled RGB Image (Max Pooling)')
plt.axis('off')
plt.show()

print(f'The original shape of the image was:{np.shape(rgb_img)}')
print(f'The new shape of the image is: {np.shape(pooled_rgb_img2)}')
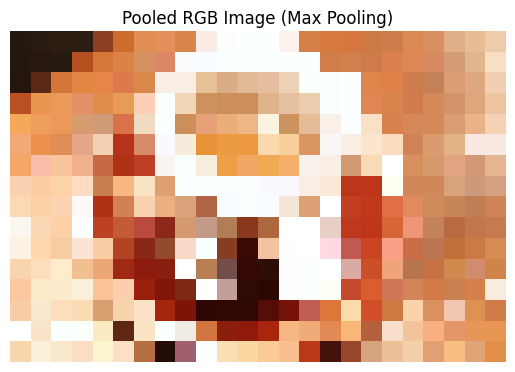
The original shape of the image was:(400, 600, 3)
The new shape of the image is: (16, 24, 3)
Congratulations! You have successfully learnt how to use the pooling_image function to use pooling methods on grayscale and RGB images. Feel free to test the function out on your own images to explore the full potential of image pooling!